新SAT考试语法题型解析之图表题
- 2016年04月01日16:00 来源:小站整理
- 参与(5) 阅读(10377)
新SAT语法题中加入了形式新颖的图表题,要求考生通过分析和概括图表中的数据来选出正确选项,并且还要兼顾此选项在语法上的正确性。图表题其实并不算难,重要的是考生们要掌握正确的解题技巧。

例如下面这道题:
Today, epidemiology is considered a basic science of public health. It is a quantitative discipline built on probability, statistics, and research methods, a method of causal reasoning based on developing and testing hypotheses, and a tool to promote and protect the health of the public. Examples of applied epidemiology include monitoring reports of communicable diseases in the community; and tracking down the cause of a food-borne outbreak. While many epidemiologists work for health departments at the local and state levels, a number are also employed by colleges and universities. (1)In 2012, the median wage for epidemiologists in the United States was around $60,000, though this number was substantially larger for those working in the state government. For those interested in pursuing a career in this field, the prospects also look bright, but employment is projected to grow 10 percent between 2012 and 2022.
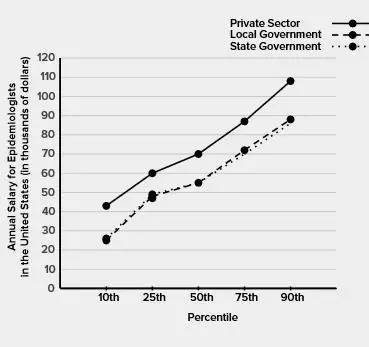
(1)After reviewing the passage and the graph, the writer determines that the statement made in the underlined sentence is not accurate. Which of the following revisions should the writer make to correct the inaccuracy?
(A) Replace $60,000” with “$50,000.”
(B) Replace “$60,000” with “$100,000.”
(C) Replace “state government” with “local government.”
(D) Replace “state government” with “private sector.”
这道题目出错率很高,错误原因并不在于数据的复杂性,而是大多数人没有仔细理解坐标单位的意义。所以解题时我们要重点注意图表的图例、坐标等信息,上面这道题目的横轴percentile表示的是百分点,即在某一百分数数值以内任意可能的数值,故在annual income在60,000的时候,private sector的百分点在25%以下,而Local Government和State Government都在50%~75%之间,明显大于private sector的比例,所以本题目答案D项也就可以轻易选出。在解上面这道题目的时候我们需要注意确认题干要求,重点在于图表数据的解读能力,正确读懂图表的信息,答案用排除法即可得出结论。
图表题的做题步骤是:
1.确定题目所在句的核心信息(划线不划线都得看),一般多为专有名词,比如时间、地点、关键词等这样一来,就可在做题时准确定位。看考察整体还是考察细节,从而进一步缩小阅读范围;
2.分析图表:包括分析图表的横纵坐标和题目;
3.按照题目要求将各选项代入图表中看是否成立。
以上讲解的关于新SAT语法考试图表题这类题型的解析希望对大家的备考有帮助。


