新SAT官方Daily Practise每日一题数学代数题
- 2017年06月27日11:25 来源:小站教育作者:小站SAT编辑
- 参与(0) 阅读(5998)
Each year from 2007 to 2015, a group of people were selected at random and surveyed about their use of online radio. The survey asked respondents whether or not they listened to online radio in the last month. The scatter plot shown gives the results of the survey, where P represents the percent of respondents who reported listening to online radio and t represents years since 2007.Which of the following equations best models the relationship between t and P?
6月官方Daily Practice 每日一练数学,点击进入
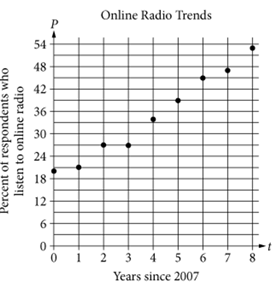
A.P=0.23t+18
B.P=t+20
C.P=2.3t+20
D.P=4.3t+18
重点单词:
slope [sləup] n. 倾斜,斜坡,斜面,斜线,斜率
survey [sə:'vei] v. 调查,检查,测量,勘定,纵览,环视
multiple ['mʌltipl] adj. 许多,多种多样的
random ['rændəm] adj. 随机的,随意的,任意的
答案:D
解析:
Choice D is correct. Drawing a best fit line on the scatter plot helps to estimate the slope and y-intercept, or in this case, the P-intercept of the line.
According to the line, the P-intercept is about (0,18)and the slope is greater than 4 but less than 6.
Therefore, of the equations given, P=4.3t+18 is the best model of the relationship between t and P.


")


